Monitoring Air Quality and Gases
Methane (CH4) in the air is a major contributor to the enhanced greenhouse effect and climate change leading to global warming, and nitrogen dioxide (NO2) is a major air pollutant that adversely impacts human health. Monitoring CH4 and NO2 emissions from anthropogenic activities on a daily, weekly, or monthly basis across an area as large as Alberta is very challenging. We use data from satellites, such as Sentinel-5P and Suomi NPP/NOAA-20 (VIIRS), to assess these emissions on a monthly and annual basis at provincial and site scales. The Sentinel-5P satellite’s TROPOMI spaceborne sensor measures CH4 and NO2 concentrations daily on a global scale from which we produce monthly and annual maps of Alberta.
More About Monitoring Air Quality and Greenhouse Gases
Fossil fuel combustion and biomass burning produce most of the Earth’s nitrogen dioxide, a gaseous air pollutant. The Sentinel-5P satellite monitors the concentration of this important trace gas in the troposphere, the lowest layer of our atmosphere. Nitrogen dioxide’s presence in the air indicates the formation of other air pollutants, such as ground-level ozone and particulate matter. We monitor nitrogen dioxide levels over our province on a monthly and yearly basis, giving us an idea of emission levels on a provincial scale and aiding the Alberta Energy Regulator with emission audits.
Learn More
Alberta Energy Regulator's emission audits
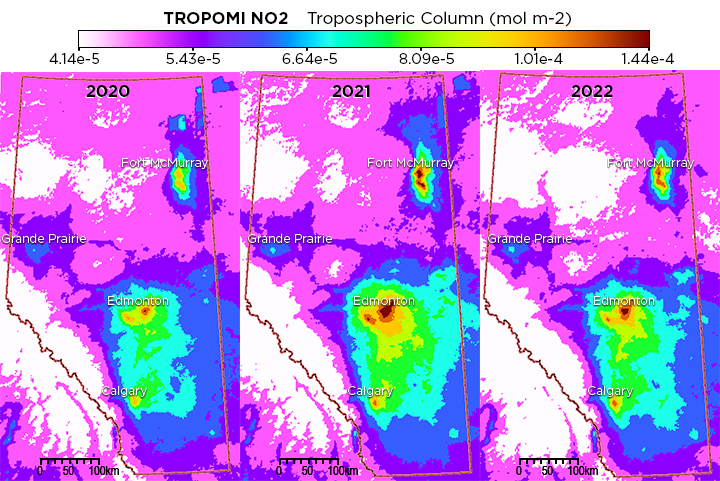
Image: Copernicus Sentinel-5P data 2020-2022
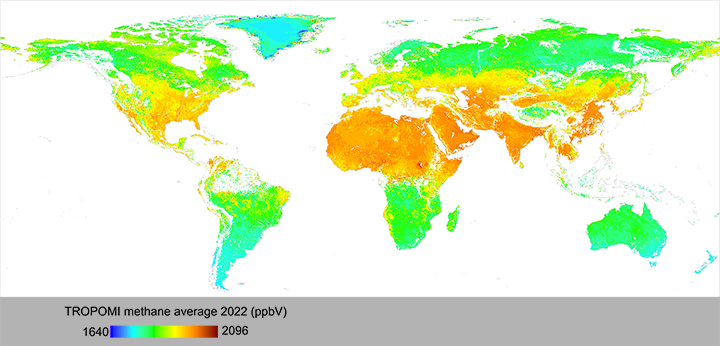
Oil and gas facilities produce waste gases including methane, a greenhouse gas that traps heat in the Earth’s atmosphere. Companies dispose of methane gas by burning it through flaring or by controlled venting to the atmosphere. Oil and gas facilities are not the only producers of methane, other sources include wetlands, farming, and other anthropogenic activities. We observe and compare overall methane emissions from these activities over time in our province using TROPOMI data from the Sentinel-5P satellite. Information gathered from this work is used to evaluate emissions reporting.
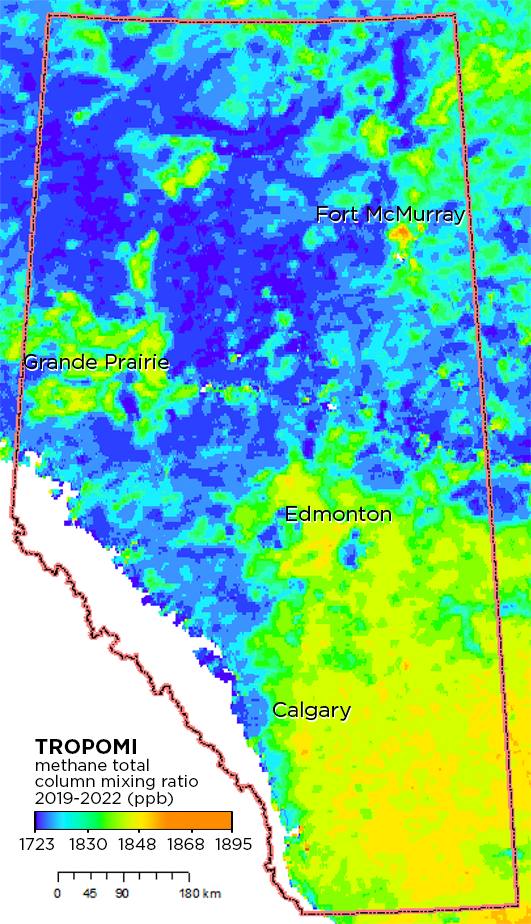
Image: Copernicus Sentinel-5P data 2022
Alberta’s energy industry regulators have worked on reducing the amount of gas flaring since 1938. Alberta’s successful efforts reducing gas flaring helped the World Bank’s Global Gas Flaring Reduction Partnership (GGFR) and other international communities create and adopt voluntary standards for reducing global gas flaring. To assist with this, the GGFR provides annual rankings of top flaring countries, based on the volume estimates produced with data from the Visible Infrared Imaging Radiometer Suite Nightfire system (VIIRS; on National Oceanic and Atmospheric Administration’s Suomi NPP/NOAA-20 satellite). This system estimates combustion source size, temperature, and methane equivalents (cubic metres per second) and carbon dioxide emission rates (grams per second) on a daily basis. We use Nightfire system data to create gas flare frequency maps of Alberta.
Learn More
Daytime Gas Flare Detection Using Landsat-8 Multispectral Data
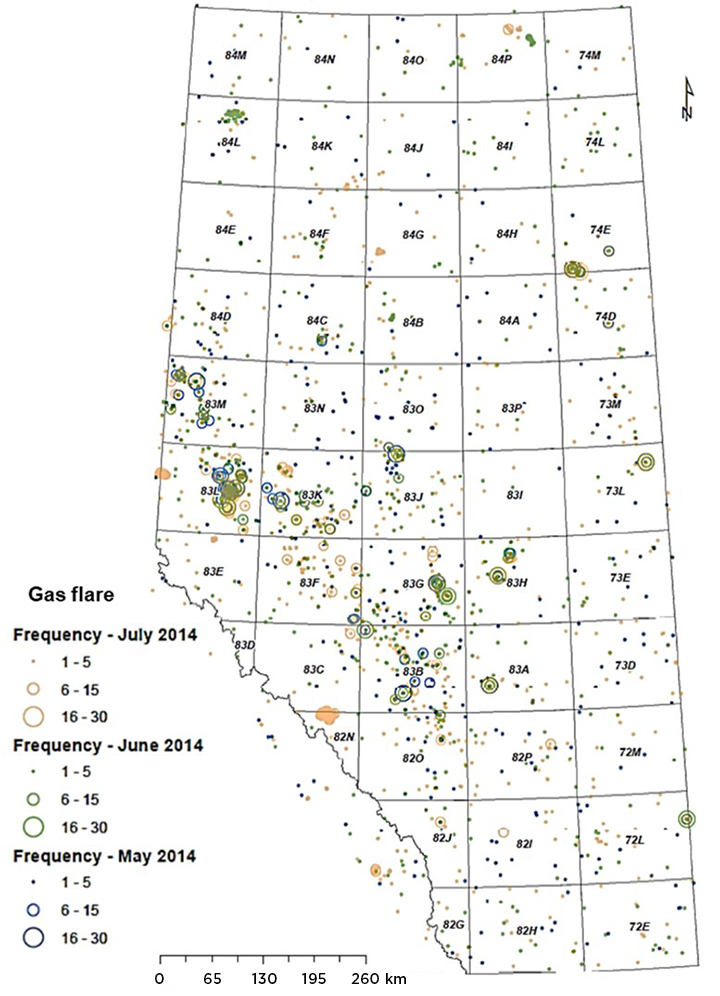
Image: Visible Infrared Imaging Radiometer Suite Nightfire data from National Oceanic and Atmospheric Administration’s National Geophysical Data Center 2014