Runout Modelling and Emergency Response Plans
Supporting studies and research on Turtle Mountain includes runout analyses for North, South, and Third peaks. Dr. John Allan identified and mapped the extent of South Peak’s hazard. Based on his runout calculations and map in 1934, the Government of Alberta issued a notice of danger to residents living in the danger zone. The Government of Alberta then offered relocation incentives to those living in the affected areas. Runout model studies are still used today by the Alberta Energy Regulator and different government agencies to develop emergency management procedures and protocols.
Turtle Mountain Runout Models
The Turtle Mountain Monitoring Program uses four separate studies completed over the past twenty years to model limits for North, South, and Third peaks. In 2000, BGC Engineering Inc. revisited Dr. John Allan’s assumed failure mechanism and volume calculations. Using modern methods to determine rockfall and runout predictions, BGC Engineering Inc. revised the original danger zones, developing the BGC Empirical Upper Limit Zone model.
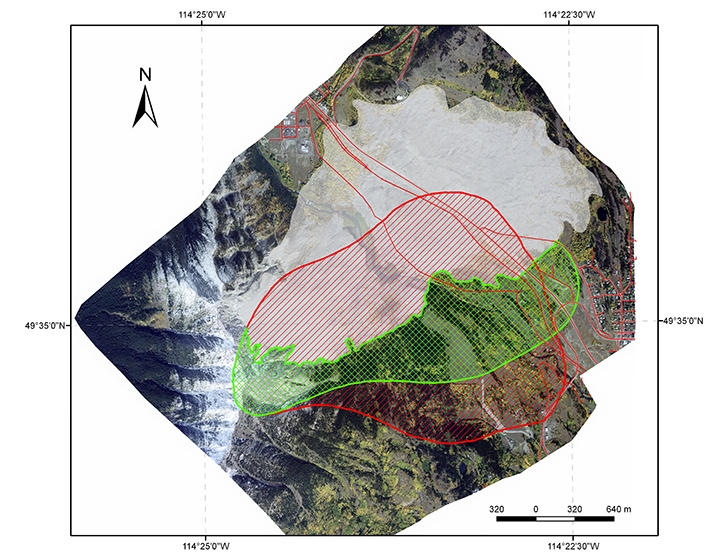
Image: BGC Engineering Inc. runout limits overlain on John Allan’s danger zone from 1934.
In 2008 and 2014, three additional studies were completed for North, South, and Third peaks. Hungr Geotechnical Research Inc. combined BGC Engineering’s study with a higher resolution digital elevation model (DEM) and improved 3D analysis to predict new runout models for the three peaks. Additional information on the Hungr Geotechnical Research Inc. runout models are available in two published reports
- Runout analyses of potential landslides of South and Third Peaks for Turtle Mountain, Alberta, Special Report 105; and
- Turtle Mountain Field Laboratory, 2014 data and activity summary, Open File Report 2015-10, Appendix 1.
The following two images illustrate the runout-modelling results for shallow and deep rock failures at North Peak. The solid colored lines depict the outline of runout extents based on 3D model analyses, and dashed lines depict the outline of runout based on 2D analyses. The different outlines show runout extents calculated by using various input values. The orange area indicates the area of failure in the model. Additional information on this study can be found in Appendix 1 of the Turtle Mountain Field Laboratory, 2014 data and activity summary, Open File Report 2015-10.
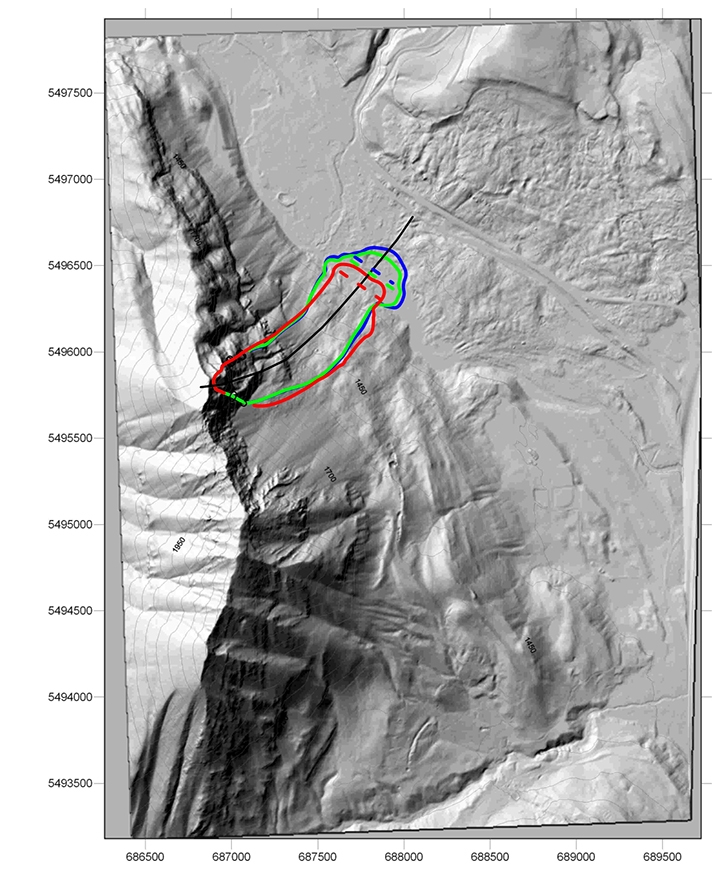
Image: Runout-modelling results for shallow rock failure at North Peak. Modified from Hungr, O. (2014): North Peak of Turtle Mountain, Frank Alberta: runout analysis of two potential landslides.
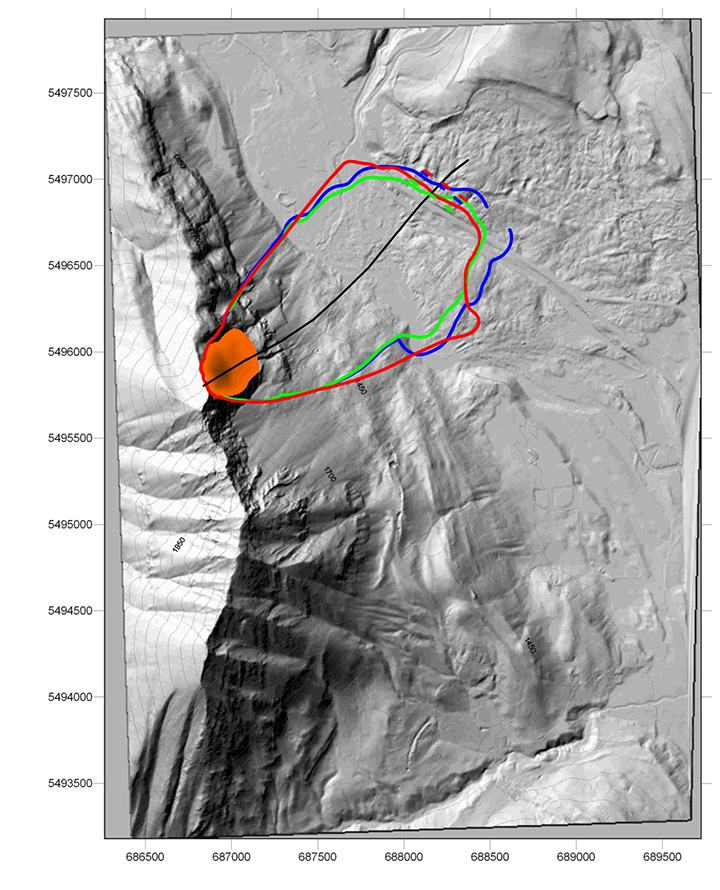
Image: Runout-modelling results for deep rock failure at North Peak. Modified from Hungr, O. (2014): North Peak of Turtle Mountain, Frank Alberta: runout analysis of two potential landslides.
The following images illustrate the runout-modelling estimate for South Peak using two different rock volume masses.
The solid and dashed colored lines show the outline of the runout extent based on 2D and 3D model analyses. The different colored lines represent the following:
- The turquoise solid line shows the extent for piecemeal detachment prediction with detachment not occurring simultaneously.
- The pink (purple) solid line shows the extent for alternative prediction with a sudden detachment under unusually dry conditions.
- The red solid line shows the extent for most likely prediction with a sudden detachment under saturated conditions.
- The yellow dashed line shows the extent for an extreme runout prediction.
Runout-modelling estimate for 6.7 million cubic metres of rock (planar small-volume rock failure) at South Peak.
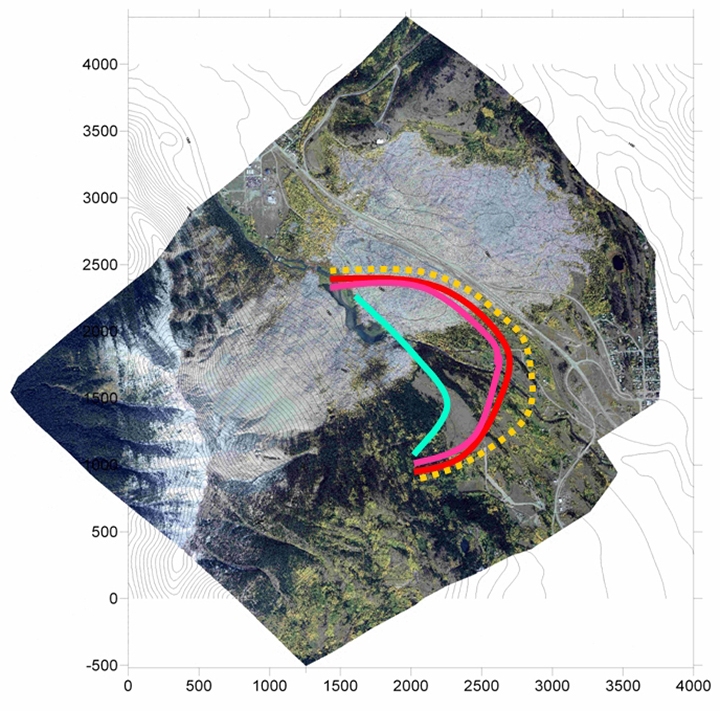
Image: Runout-modelling estimate for South Peak for 6.7 million cubic metres (planar small-volume mass). Figure from Hungr, O. (2008): Runout Analyses of Potential Landslides of South and Third Peaks, Turtle Mountain, Alberta.
Runout-modelling estimate for 13.8 million cubic metres of rock (single deep-seated volume rock failure) at South Peak.
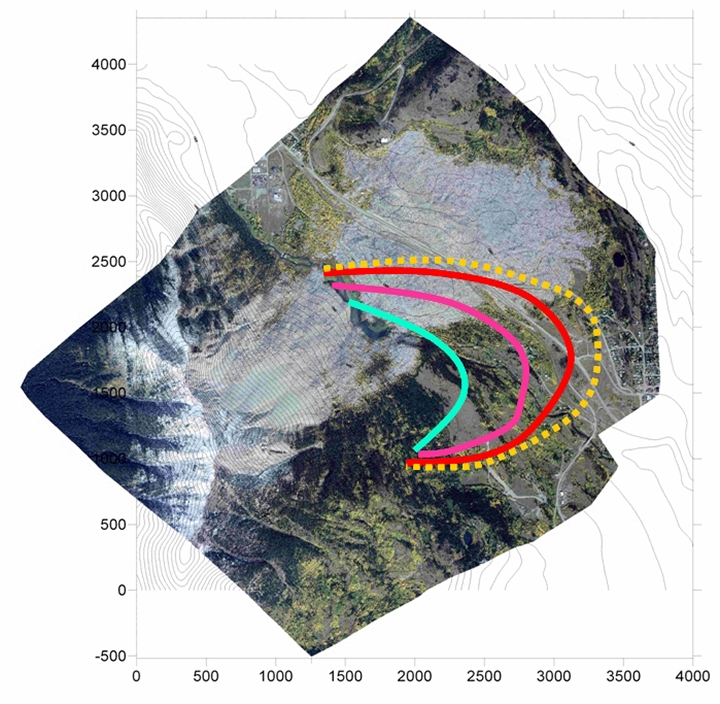
Image: Runout-modelling estimate for South Peak for 13.8 million cubic metres (single deep-seated volume mass). Figure from Hungr, O. (20147): Runout Analyses of Potential Landslides of South and Third Peaks, Turtle Mountain, Alberta.
In 2008, three runout models were produced for Third Peak to predict runout extents for potential source volumes ranging from 54,000–2.59 million cubic metres. Additional information on the study can be found in Special Report 105 – Runout analyses of potential landslides of South and Third Peaks for Turtle Mountain, Alberta.
The Turtle Mountain Monitoring Program used the runout models to develop our current emergency response plans and protocols. Additional information on our roles during an emergency response can be found in our Roles and Responsibilities Manual for the Turtle Mountain Monitoring Program. This report provides information regarding our ownership of the Turtle Mountain Monitoring System and the specific roles and responsibilities of our staff during normal operations and varying alert levels. This manual also includes internal procedures for notification to the Alberta Emergency Management Agency should significant rock movements occur on Turtle Mountain.
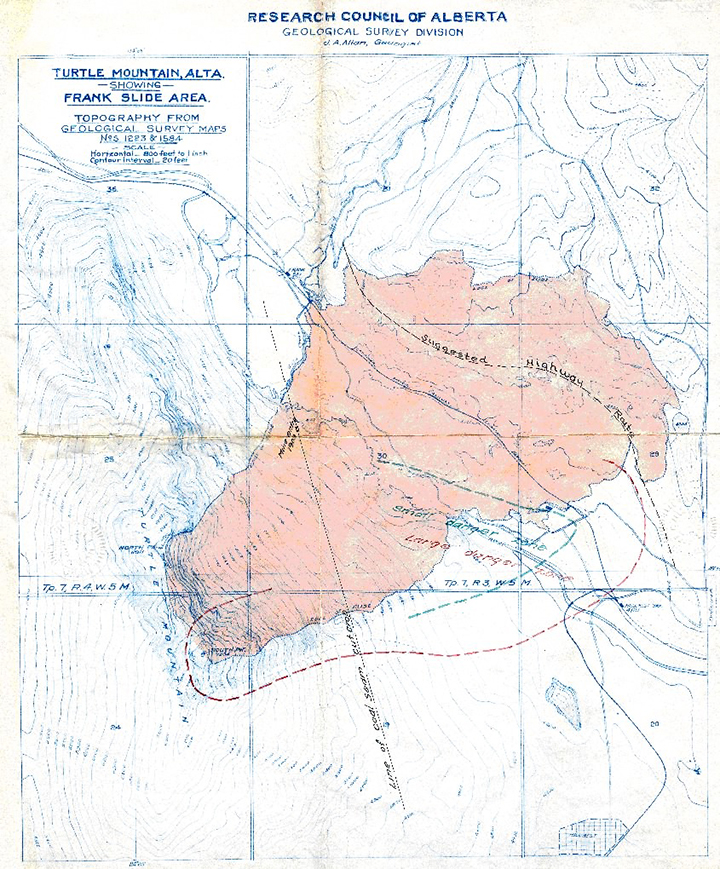
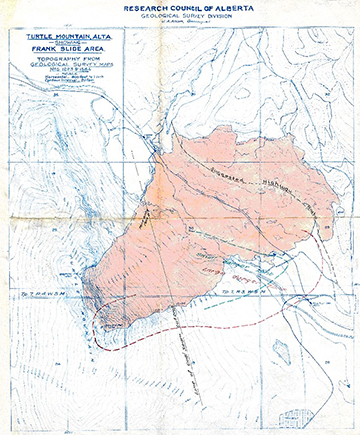
Image: Dr. John Allan’s map of the Frank Slide danger zones in 1934. The blue outline depicts a smaller runout zone, and the red outline depicts a larger runout zone.