Detecting Spills and Assessing Impacts
Over the past three decades, publicly available Landsat imagery has evolved into a valuable resource for decision makers in various fields such as emergency response, ecological monitoring, and incident investigation. We analyze Landsat-8 and Sentinel-2 satellite imagery and provide information to decision makers about the duration of spill events and how the remediation for these events proceeded. This information helps optimize spill mitigation measures, prevention, and remediation planning.
More About Incident Response
Spill detection using satellite imagery helps investigators reconstruct incident scenarios, when considered with other information sources such as containment pond capacity, pipeline maintenance history, and witness statements. Although Landsat-8 satellite imagery has limitations, such as the 16-day revisit time and cloud cover interfering with the usefulness of some scenes, it is successfully used as an investigation tool. Other publicly available imagery, such as Sentinel-2 multispectral satellite imagery with improved 10 m spatial resolution and more frequent imaging of six-day revisit time, serves as an additional resource to assist spill incident investigations.
When assisting spill response and investigation, we analyze satellite images detecting signs of seepage or spills. For example, in 2013 we aided an investigation of a spill at a coal mine 30 km east of Hinton in west-central Alberta. On October 31, 2013, 670 000 cubic metres mine wastewater and solids flowed down a local creek and into the Athabasca River downstream of Hinton. We used Landsat-8 satellite imagery to show signs of seepage six days before the structural failure of the coal mine’s wastewater containment pond.
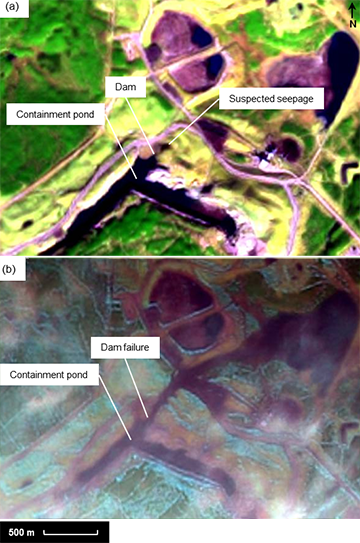
Image: Landsat-8 images courtesy of the U.S. Geological Survey
Learn More
The Role of Landsat-8 Multispectral Data in Spill Response: Three Case Studies
The Role of Multispectral Satellite Imagery for Inland Spill Response in Alberta
With the analysis of satellite imagery, we can reveal the timeline of a pipeline spill and outline the extent of the affected area. For example, in 2016 we investigated a crude oil and saline water pipeline spill that occurred 15 km northeast of Fox Creek in northwestern Alberta. When the spill was reported on October 6, 2016, the start of the release was unknown, but the extent of impacted vegetation suggested that considerable time had elapsed since the spill began. Our analysis of Landsat-8 and Sentinel-2 imagery suggested the area affected by the spill increased gradually from 300 square metres on June 9, 2015, to 4000 square metres on August 30, 2016.
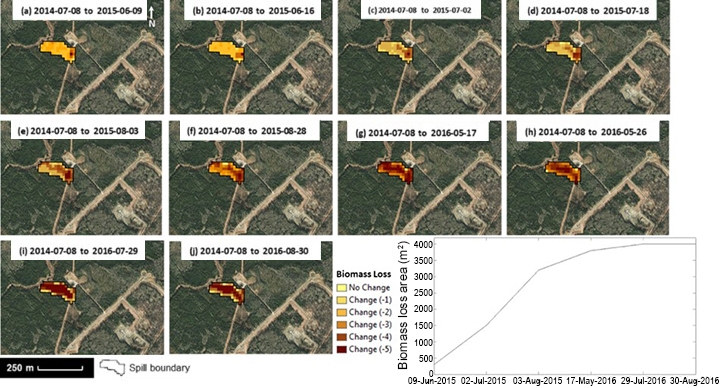
Image: Landsat-8 images courtesy of the U.S. Geological Survey; underlying SPOT 6/7 imagery 2015 © Planet Labs PBC