MAP 630
| Author(s) | Date | 2023-03-07 |
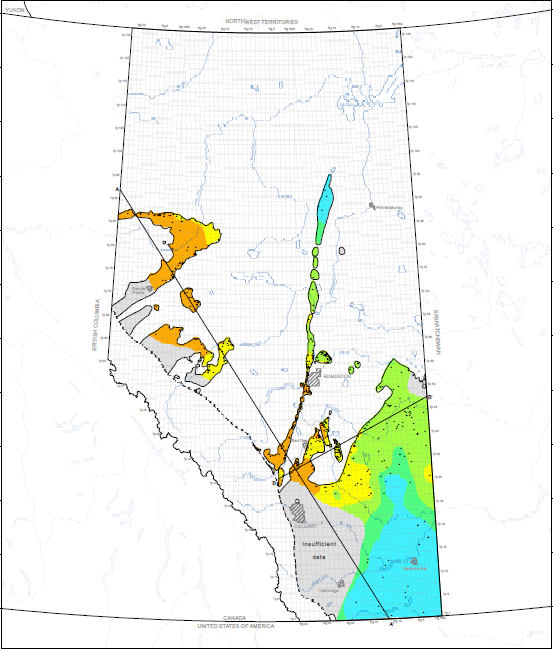
This map depicts the concentration of total dissolved solids (TDS) in groundwater in the Leduc hydrostratigraphic unit (HSU). The map is a result of an empirical Bayesian kriging technique using publicly available water chemistry data from oil and gas wells.
The distribution of TDS was mapped at a regional scale using many years of data, thus providing a good indication of regional water chemistry within the unit rather than site-specific values. The uncertainty of prediction is depicted on an inset map, which shows the residual values (predicted value minus measured value) plotted at each location to indicate where underprediction or overprediction occurs. Two additional inset maps show the distribution of hydraulic heads and the results of water driving force analysis, respectively. The geometry and variable thickness of the Leduc HSU are illustrated on schematic cross-sections, and the relationship between geological units is further described in an accompanying regional lithostratigraphic and hydrostratigraphic table.
NTS Keywords
Brinsky, J. (2023): Distribution of total dissolved solids in the Leduc hydrostratigraphic unit; Alberta Energy Regulator / Alberta Geological Survey, AER /AGS Map 630, scale 1:3 000 000.